


I know there's already hundreds of cf analytic projects but trust me i have cool graphs to show. check out the website on
https://cf-cool-graphs.vercel.app/
Cool Features:
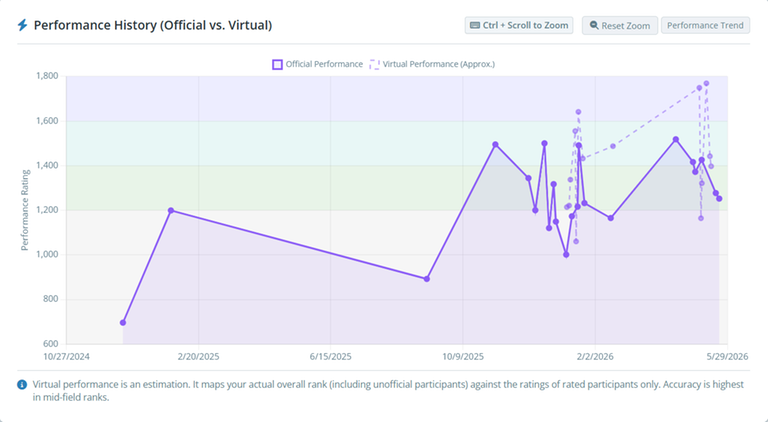
Performance Calculator:
-> Calculate your in-contest and virtual performance (i know tle bot can calculate performance but it doesn't do virtual performance); virtual performance is just an estimate based on your placement compared to the official rankings; Because I am poor the calculations will take a bit of time so sorry about that; but we do cache the calculations so it is faster next time; I also cache the contests queried if it is not yet cached so it will be faster the more the service is used;
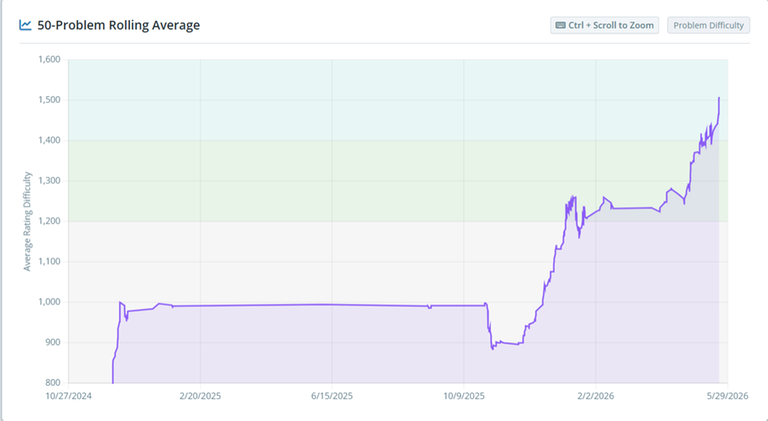
Rolling Average:
-> Gives your 50-problem rolling average ratings; This is my favorite graph to be honest; its a good tell if you are improving or not, even if the rating is quite flat; I attached my recent 50-day average and it was quite motivating cause I am stalling in rating;
Upsolve Tracker:
-> It just shows if you upsolved the problem after contest; The upsolve rate is strictly based on the next unsolved problem of the contest but the upsolve count also counts problems after that; Say you don't solve D, but later you upsolve D and E, it adds to the upsolve count twice but only D is counted for upsolve rate;
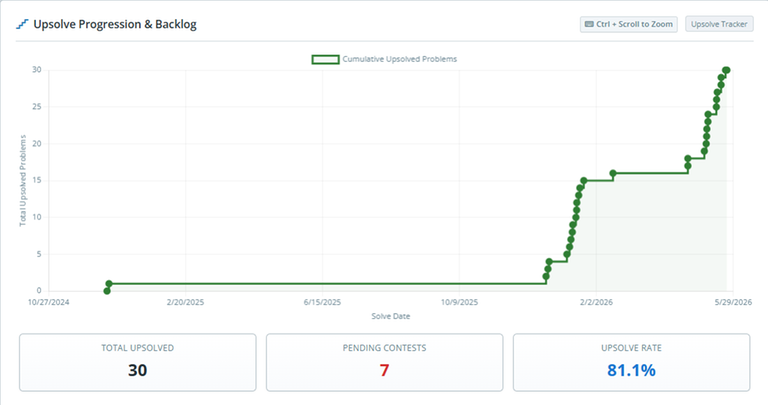
(There's also a list of all the problems you have to upsolve at the bottom of the graph;)
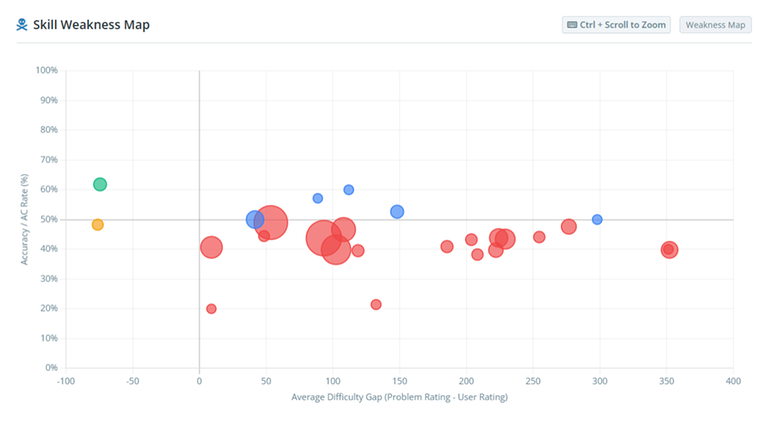
Weakness Map:
-> Just compares the tag rating compared to the rating you had when you solved it; the farther right it is, the higher the rating of the tag is compared to your rating; the lower it is, the worse your AC rate is; the size of the circle is for the amount of solves that tag has;
There's a bunch more on the site, but those graphs are my favorite ones :); please check them out and tell me if you have some ideas for more graphs to plot!
Other graphs:
-> Plot rating with max-problem-rating overlaid;
-> Tag-specific Rolling Average
-> Solve count graph
-> Rating buckets
-> Rating Heatmap
-> Solved tags
-> Tag AC rate (sorted)
-> Solve time (per rating based on contest and virtual performance)
-> Activity (Time in your timezone where you solve the most problems)
-> Rating AC rate


Auto comment: topic has been updated by DarkestBlade (previous revision, new revision, compare).
Auto comment: topic has been updated by DarkestBlade (previous revision, new revision, compare).
Auto comment: topic has been updated by DarkestBlade (previous revision, new revision, compare).
Btw as of now, the performance query fails if you participate in gyms... I'll fix that later; sorry about that;
Amazing platform! The data visualization is very accurate. It only needs a better color palette to make the experience even better.
thank you