


Hello Codeforces!
Like many of you, I struggle to visualize grid/coordinate geometry problems when I don't have a pen and paper handy. Debugging DFS/BFS paths or complex geometry on a blank screen is painful.
I couldn't find a simple, lightweight tool that did exactly what I wanted, so I built CP Grid Visualizer.
It's a single-file, browser-based tool to instantly plot points and lines on an infinite grid.
Link: https://himalaya-pahar.github.io/cp-grid-visualization/
github repo: https://github.com/himalaya-pahar/cp-grid-visualization
Features:
Infinite Grid: Handles negative coordinates and large ranges easily.
Fast I/O: Type X [Enter] Y [Enter] to add points rapidly (just like entering test cases).
Interactive: Click points to connect them with lines.
Export: One-click "Download Image" to save your visualization (great for editorials or asking for help).
Dark Mode: Because we are programmers.
How to use:
Enter coordinates on the left sidebar.
Left-click points to select/connect them.
Right-click a point to delete it.
Scroll to zoom, drag to pan.
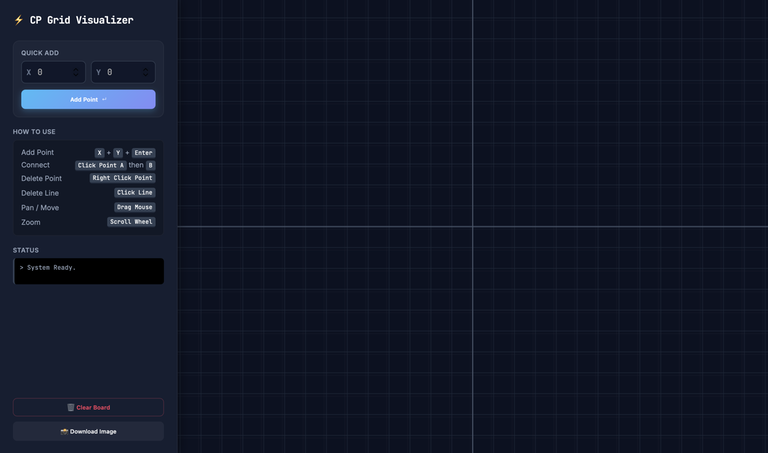
UI of CP Grid Visualizer
Visualizing the third sample case for 2193F — Pizza Delivery. Calculated the optimal path visually in seconds

Problem link: https://mirror.codeforces.com/contest/2193/problem/F
I kept it very simple (just HTML/JS) so it's fast and works offline if you save the file.
Let me know if you find any bugs or have feature requests!


