


Hi everyone, I made a website using the Codeforces API that can graph your Rating vs Count of Problems Solved. I can also filter to see how you're improving if you only count problems of a specific rating or higher.
The URL is https://codeforcesplot-app-5def7a85c434.herokuapp.com.
This is the application UI: 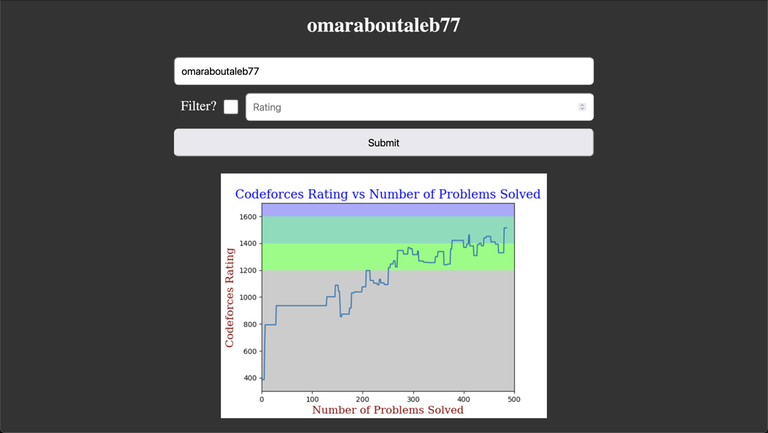
By default, the website displays all problems, but you can filter the problems to only display problems above a specific rating.
You also no longer need a CLIST account to be able to plot your data. All codeforces accounts work.


great work, thanks!
can you plot the graph for me ? Thnaks
I built something similar as well. https://hitarth-gg.github.io/codeforces-explorer/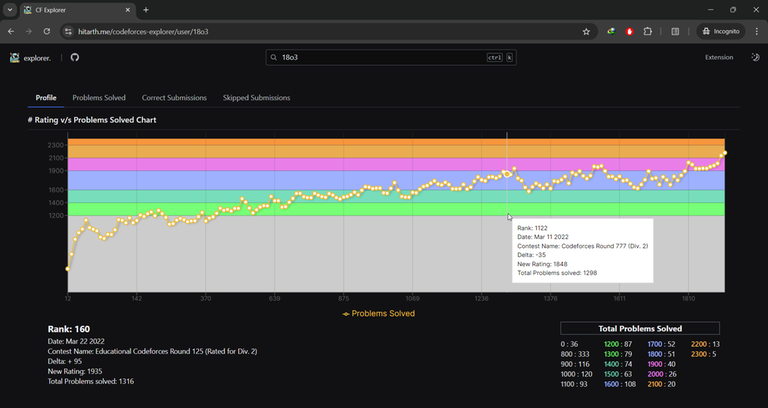
Wow, this is insane! This is essentially what I wanted to build (slightly different scaling on the X Axis), but much more polished.
Great work OmarAboutaleb77, I tried something similar in a mobile application available on google play store, but i got few challenges in getting the content of any blog. Is there any way we can achieve this.
checkout the application here: https://play.google.com/store/apps/details?id=com.ethosforces&hl=en_IN
That looks nice... is it possible to make an extension version of this too?