


Hi, this is my first post on Codeforces!
I have built a Codeforces Submission Analyzer, a tool that helps you analyze and visualize your submission history using the Codeforces API. It provides insights into your coding efficiency, memory usage, and performance trends.
Why you should install this extension?
- Analyze your submissions – Track time & memory usage.
- Visual insights – Interactive charts & graphs.
- Compare with others – Benchmark your performance.
- Clickable data – Open submissions directly from graphs.
How to install:
- Download the extension from GitHub: my GitHub repo
- Extract the ZIP file to a folder.
- Open Chrome and go to chrome://extensions/.
- Enable Developer Mode (top-right corner).
- Click "Load unpacked" and select the extracted folder.
- Done! The extension is now installed and ready to use.
Please, give it a try.
If you find any kind of bug, please let me know so I can fix it. If you have any idea of feature that can be useful, please let me know. I will try to add it.
Here are some screenshots of the extesion - 
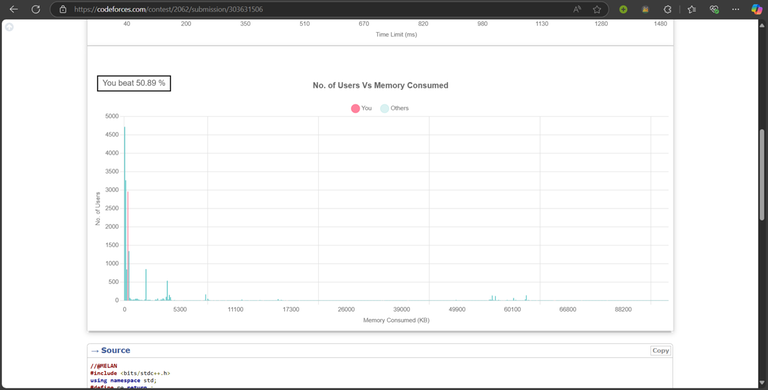
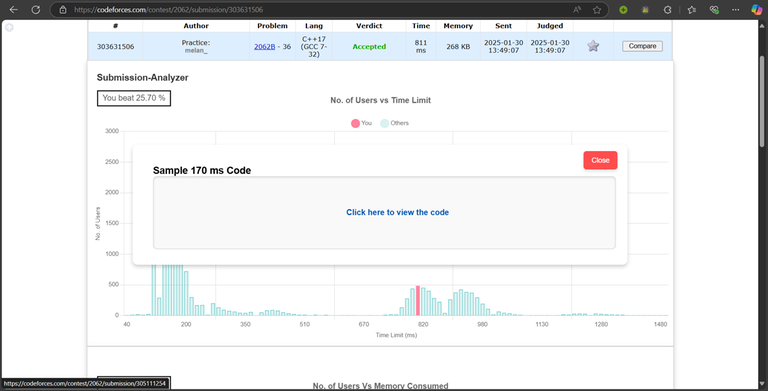
I'd like to thank MikeMirzayanov for the great Codeforces platforms with shared API.
UPD: It's available now for Firefox, Thanks for your support.


Wonderful! I tried it, and it's exactly what I was missing on Codeforces. Finally, I found it! Looking forward to more creativity.
How to use it in Microsoft Edge?
firstly download zip file from Github and extract it, then go to edge://extensions/ and then load unpack
Looks Really Cool, gonna have to give it a try :)
Amazing... Working fine in my Opera browser.
Great work! But I suggest you to make the x-axis linear. I think [100 200 500 600] or something like that is kind of confusing.
Where can I get it on Firefox?
I haven't uploaded it to the Firefox Add-ons store yet. Please stay tuned—I’ll try to make it available as soon as possible!
Can you make it work per-language? Don't think it really makes sense to compare across languages.
I can't see the graph, the extension is on.
(screenshot)
Your URL should look like this: https://mirror.codeforces.com/contest/{contest_id}/submission/{sub_id} Just remove "?locale=en" from the link, and it will work.