


MikeMirzayanov in this blog asked a question about fighting against meaningless blogs, so I am in hurry to post this picture before rules become strict :-)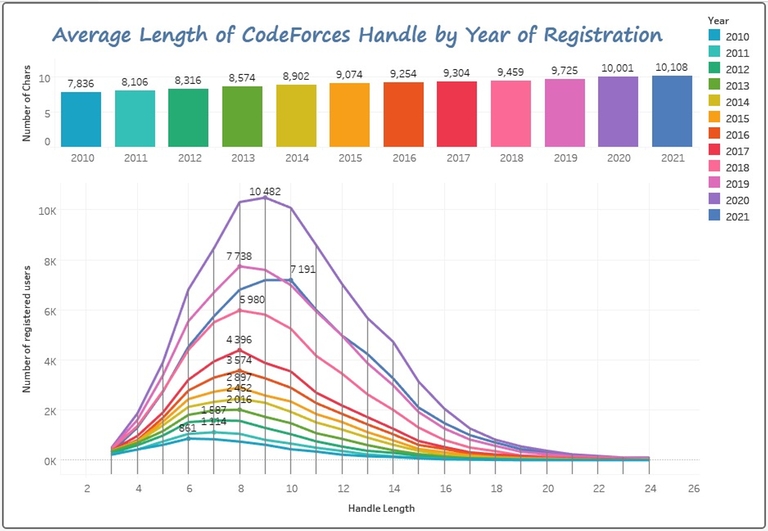 .
.
Line chart shows distribution of handle length by year of registration. Dashboard is created using Tableau. Guys, I love it, Tableau is great! It is possible to look at more details when you hover charts on dashboard directly. Dashboard is based on data downloaded by python script using Codeforces API.
→ Pay attention
→ Top rated
| # | User | Rating |
|---|---|---|
| 1 | tourist | 3856 |
| 2 | jiangly | 3747 |
| 3 | orzdevinwang | 3706 |
| 4 | jqdai0815 | 3682 |
| 5 | ksun48 | 3591 |
| 6 | gamegame | 3477 |
| 7 | Benq | 3468 |
| 8 | Radewoosh | 3462 |
| 9 | ecnerwala | 3451 |
| 10 | heuristica | 3431 |
→ Top contributors
| # | User | Contrib. |
|---|---|---|
| 1 | cry | 167 |
| 2 | -is-this-fft- | 162 |
| 3 | Dominater069 | 160 |
| 4 | Um_nik | 158 |
| 5 | atcoder_official | 157 |
| 6 | Qingyu | 156 |
| 7 | djm03178 | 152 |
| 7 | adamant | 152 |
| 9 | luogu_official | 150 |
| 10 | awoo | 147 |
→ Find user
→ Recent actions


Codeforces (c) Copyright 2010-2025 Mike Mirzayanov
The only programming contests Web 2.0 platform
Server time: Feb/23/2025 08:57:54 (k1).
Desktop version, switch to mobile version.
Supported by

I though you were going to associate handle length with rating. I'm disappointed.
I think that short handles all are registered before and now new users are forced to register long usernames.
Handle Leng th
under the graph