


Hello community,
I've recently added new graphs on the CodeSync website, like Question Rating vs. Average Time Taken During Contest, Questions Solved Count vs. Rating , etc. Below are some screenshots showing how they look based on my Codeforces ID:
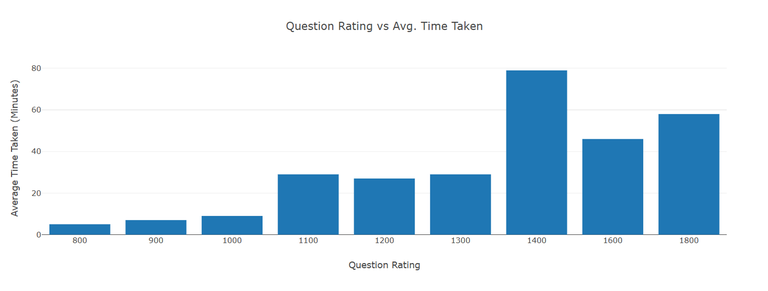
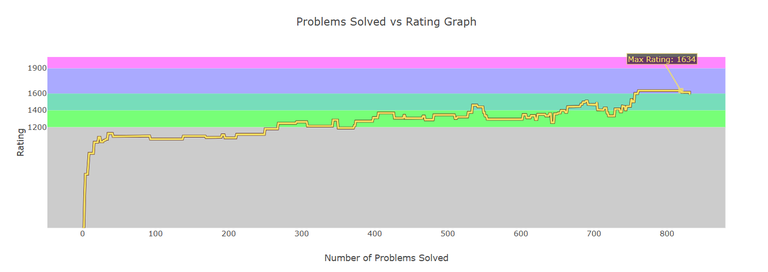
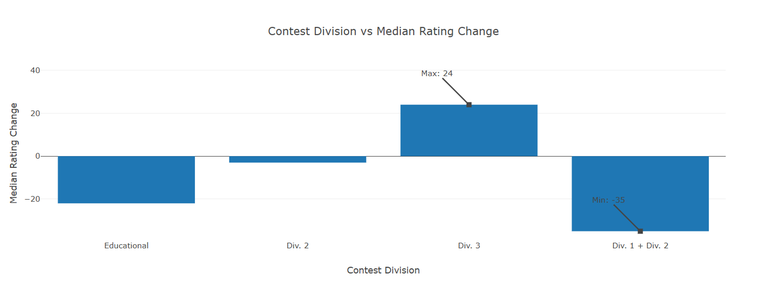
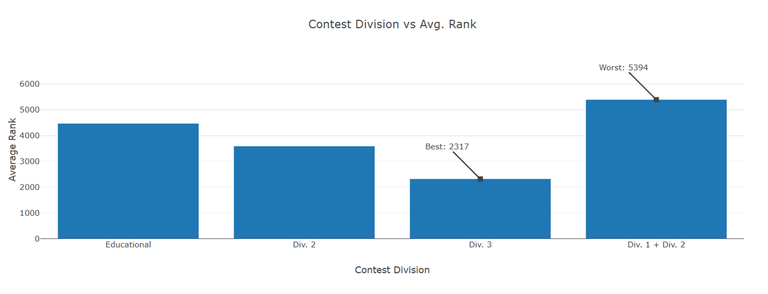
If you're interested, simply type your Codeforces handle and click enter. Here's the link to the website:
https://code-sync-sandy.vercel.app/graphs
You might also want to explore the CodeSync website itself. It's a platform where you can simulate virtual contest-like environment with questions fetched based on your input. It's great for Team Contests (as it fetches common unsolved questions), virtual contests, and even for practice.
If you have suggestions for additional meaningful graphs or encounter any bugs, please let me know in the comments.
Thank you

