


Hello community,
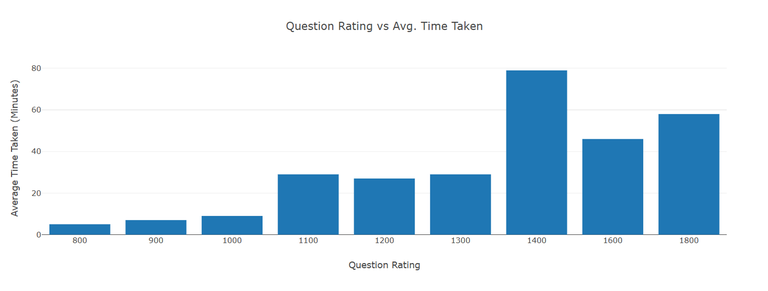
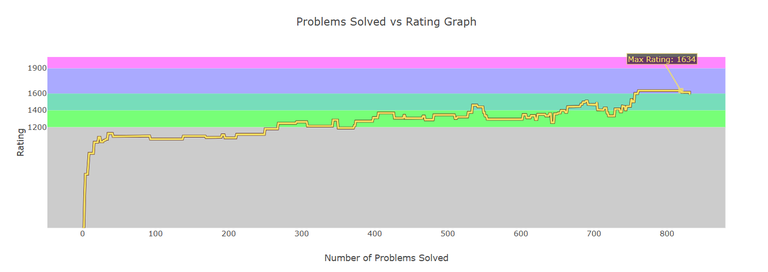
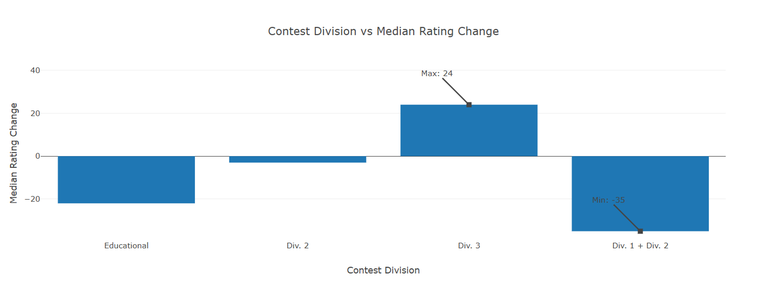
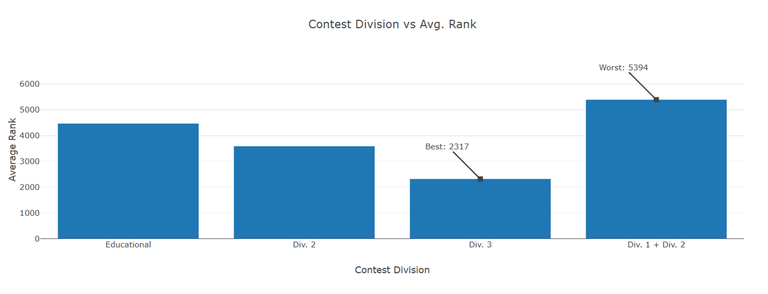
I've recently added new graphs on the CodeSync website, like Question Rating vs. Average Time Taken During Contest, Questions Solved Count vs. Rating , etc. Below are some screenshots showing how they look based on my Codeforces ID:
If you're interested, simply type your Codeforces handle and click enter. Here's the link to the website:
https://code-sync-sandy.vercel.app/graphs
You might also want to explore the CodeSync website itself. It's a platform where you can simulate virtual contest-like environment with questions fetched based on your input. It's great for Team Contests (as it fetches common unsolved questions), virtual contests, and even for practice.
If you have suggestions for additional meaningful graphs or encounter any bugs, please let me know in the comments.
Thank you


Auto comment: topic has been updated by simplesheep03 (previous revision, new revision, compare).
this is very cool, good job
This graphs gives you reality check.
Are you sure I took an average of 302 minutes to solve 2300-rated problems over the past 20 contests?
Thank you for pointing that out. I've removed stats from non-relevant contests like the Kotlin heroes practice round.
It took me 1 minute to solve *2800 problem lol.
They're something like D1 & D2. I think it'd be better to calculate the time used for D2 as the sum of (D1 + D2).
Thanks for the suggestion! I've made the modifications :))