


tl;dr: https://giraphe.netlify.app/
(Passage translated by Claude)
Graph theory is an important topic in competitive programming, and we often need to insert graph images in problem statements, solutions, and blog posts to make explanations clearer and more intuitive. So, what are the common approaches to drawing graphs?
- MS Paint school: The positions of vertices, edges, and text are determined by hand tremors, making it difficult to maintain a consistent style. Lines, circles, and other shapes lack anti-aliasing.
- CSAcademy school: Using the Graph Editor, specifically designed for graph theory, it automatically adjusts vertex positions to make the graph clear and intuitive. However, it's difficult to customize individual vertex and edge styles or precisely set vertex positions. The exported bitmap resolution is also low.
- Typesetting language school: Using packages in LaTeX/Typst to draw graphs, allowing precise positioning and consistent styling, resulting in high-quality vector or bitmap images. However, drawing with code is not very intuitive.
- PowerPoint school: Allows free adjustment of vertex and edge styles, and uses alignment and snapping to adjust vertex positions. Can produce high-quality vector or bitmap images. However, as the number of vertices and edges increases, the snapping positions become less useful. Adjusting edge endpoints is also inconvenient.
- Various other niche approaches.
As we can see, existing graph drawing solutions have their pros and cons, making it difficult to meet all user needs. To address this, I've created a new graph drawing tool called Giraphe (https://giraphe.netlify.app/). While this project still has room for improvement, it can already satisfy many use cases. Feel free to try it out!
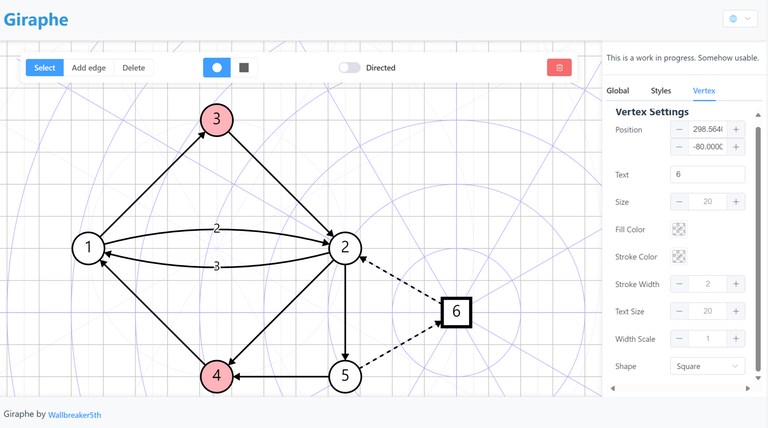
Its main features include:
- Basic creation of vertices and connecting directed/undirected edges
- Edge labels
- Curved edges
- Vertex alignment with grids (absolute or relative to another vertex)
- Various style settings
- Saving and loading created graphs
- Exporting to SVG
(Note: Indeed, it cannot automatically generate graphs from textual descriptions. It's primarily designed for users who already have a clear structure in mind and want to use human intuition to create visually appealing layouts and drawings.)


