


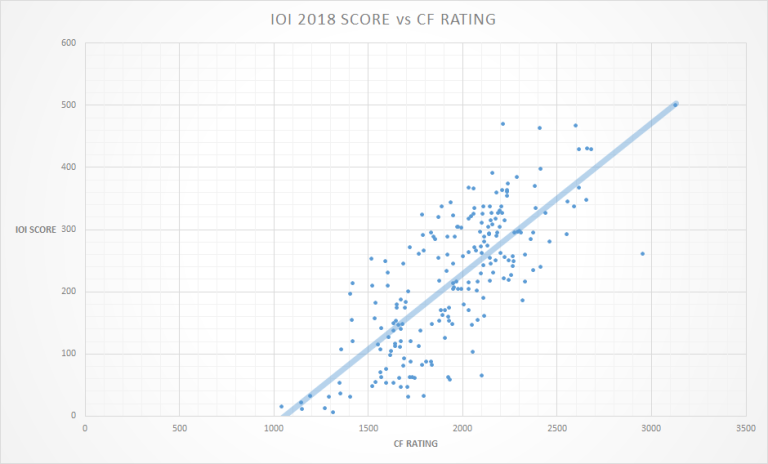
Total Score Distribution
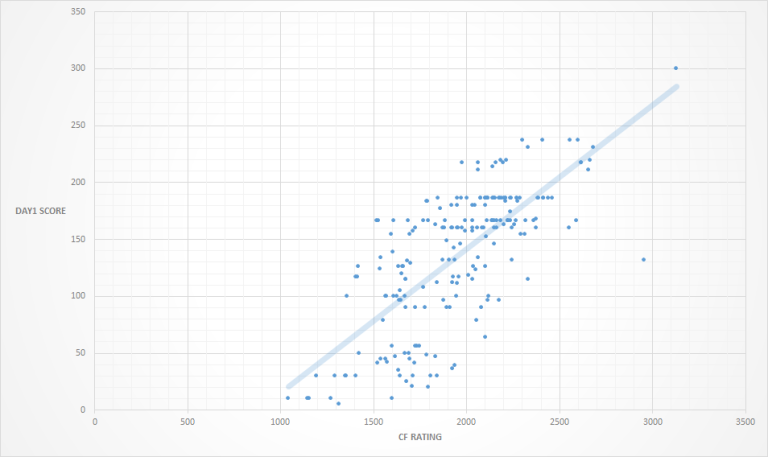
Day 1 Distribution
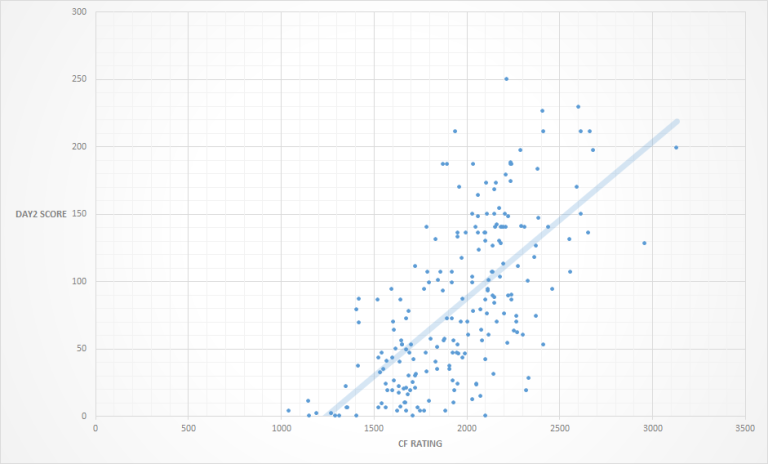
Day 2 Distribution
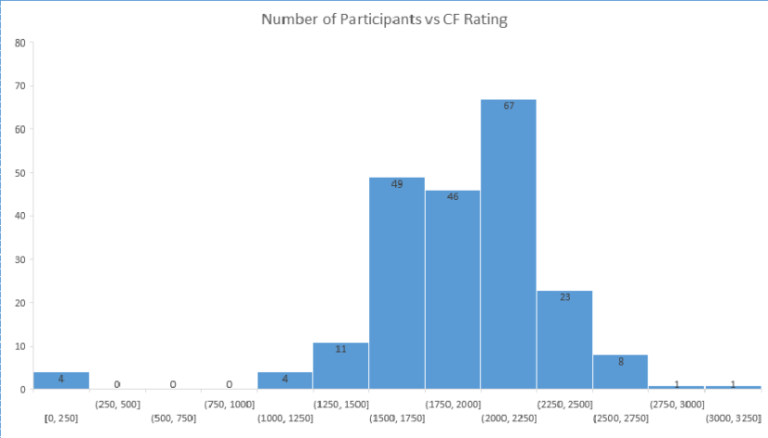
This data was generated using 214 contestants whose codeforces' handles were available at the IOI statistics profile and using CF API Wrapper (which will be released tomorrow) to generate CF data.
Can you guess which point is Benq? ^^
Bonus:


Nice graph.
It would be better to add labels on the X-axis and Y-axis. I know the X-axis is the CF rating and the Y-axis is the IOI score. But it would be better and more clear to write them next to the axis.
[UPD] Thanks for adding them :)
Can you spot the saddest dot in the picture? =(
Do you mean geniucos? :((
I can confirm that’s the correct answer
Added day1/2 separate graphs.
What software have you used for this?
My own wrapper which I am releasing today.
Looking forward to seeing it!