UPDATE
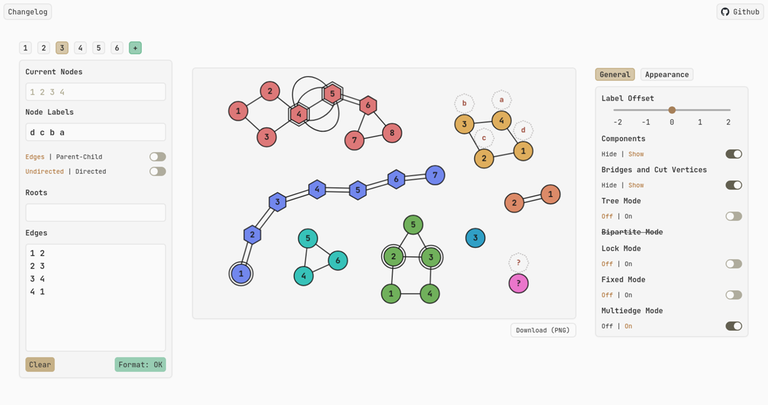
There have been a few new features since its initial release.
- Multiple graphs/testcases (each "tab" can store its own testcase so you can visualize all testcases at once)
- Multi-edge support
- Bipartite mode
- More appearance-related configuration sliders
Thanks for all the support and suggestions! Things will continue to be added slowly over time, but if there's a particular feature that you want you can just open an issue on GitHub.
Hello, Codeforces!
I've been working on a graph visualization tool for a while now, and because I couldn't think of a good name for it, I've opted to call it Another Graph Editor. If you have any name suggestions, pls let me know. Here's the website and the repo.

The layout is very much inspired by CS Academy's graph editor. Input is pretty straightforward too, as you may just copy paste the test case edge data into the text area using the form u v w, where w is an optional edge label. You do not need to enter n m, representing the number of nodes and vertices respectively.
Node labels are supported too! Suppose the problem offers an array a where a[i] represents the value at node i, you can just copy-paste it into Node Labels and it'll show up as little octagons hovering over the node. If you want to skip over a particular node (aka an empty label), use the character '_' as a placeholder.
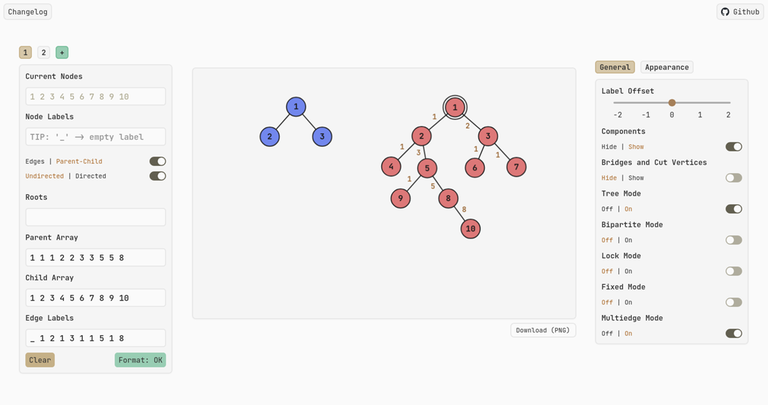
In addition, to handle problems where you are given an array p where p[i] represents the parent of node i, you can click on Parent-Child, and you will be presented with a more convenient interface:

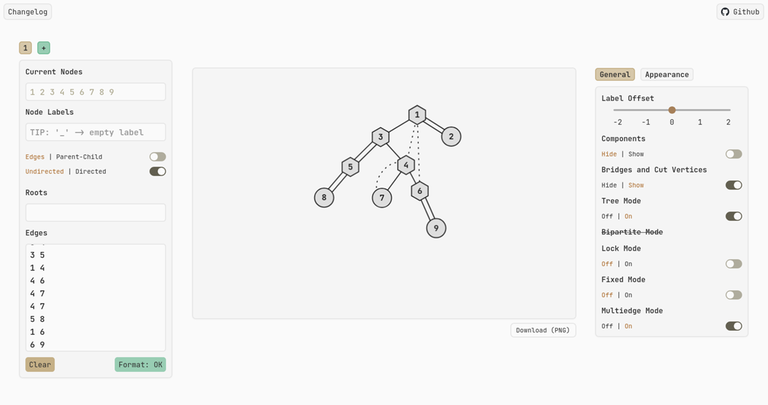
On the right, you may toggle Tree Mode, which rearranges the graph into a tree as you'd expect. If your graph isn't a tree, that's okay too! You'll be greeted with a DFS tree instead, best explained in this awesome blog.

By default, the first node that appears in the input data is the root. If you require some other node u as the root, a tip is to put it on the first line as either u or u u, or if you're in Parent-Child mode, you can prepend u to the front of the parent and child arrays.
Some other niceties include a dark mode, mobile support, the ability to show components (or strongly-connected components for directed graphs), as well as bridges and cut vertices.
Finally, use the Label Offset slider on the right panel to convert a zero-indexed input into one-indexed and vice versa. For example, if the input is one-indexed, use an offset of -1 to make it zero-indexed. Nodes with English characters or emojis as input would not be affected by the offset.
Welp, that's about it. Hope you enjoy using it! If you find any bugs or have any feature requests, do let me know. When I learn more advanced stuff like network flow, I might integrate it into the editor for convenient visualization.


