


Hello community,↵
↵
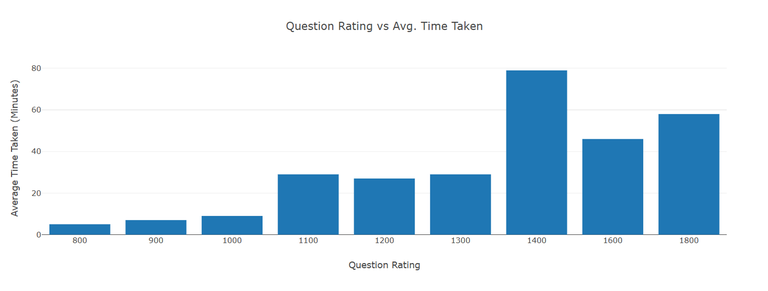
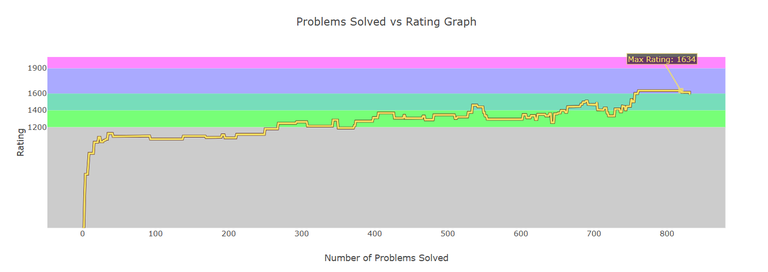
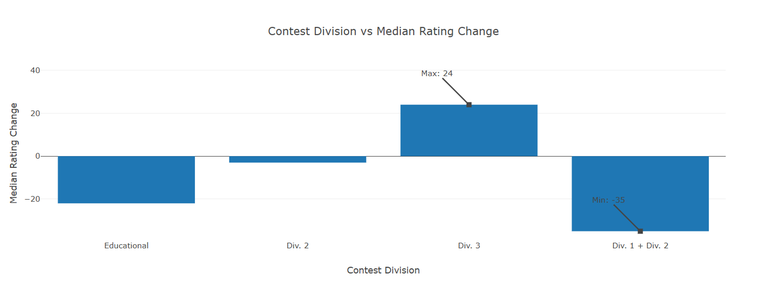
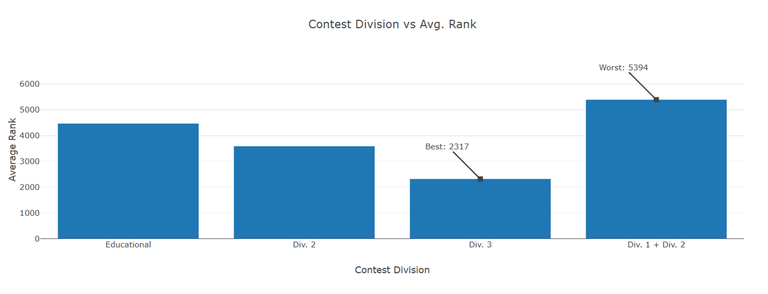
I've recently added new graphs on the CodeSync website, like Question Rating vs. Average Time Taken During Contest, Questions Solved Count vs. Rating , etc. Below are some screenshots showing how they look based on my Codeforces ID:↵
↵
↵
↵
↵
↵
↵
↵
↵
↵
If you're interested, simply type your Codeforces handle and click enter. Here's the link to the website:↵
↵
https://code-sync-sandy.vercel.app/graphs↵
↵
You might also want to explore the CodeSync website itself. It's a platform where you can simulate virtual contest-like environment with questions fetched based on your input. It's great for Team Contests (as it fetches common unsolved questions), virtual contests, and even for practice.↵
↵
If you have suggestions for additional meaningful graphs or encounter any bugs, please let me know in the comments.↵
↵
Thank you
↵
I've recently added new graphs on the CodeSync website, like Question Rating vs. Average Time Taken During Contest, Questions Solved Count vs. Rating , etc. Below are some screenshots showing how they look based on my Codeforces ID:↵
↵
↵
↵
↵
↵
↵
↵
↵
↵
If you're interested, simply type your Codeforces handle and click enter. Here's the link to the website:↵
↵
https://code-sync-sandy.vercel.app/graphs↵
↵
You might also want to explore the CodeSync website itself. It's a platform where you can simulate virtual contest-like environment with questions fetched based on your input. It's great for Team Contests (as it fetches common unsolved questions), virtual contests, and even for practice.↵
↵
If you have suggestions for additional meaningful graphs or encounter any bugs, please let me know in the comments.↵
↵
Thank you

