


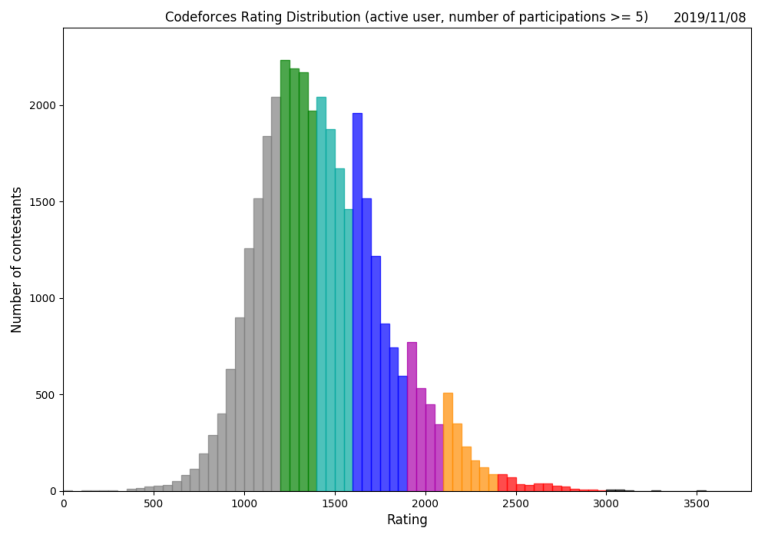
Since I couldn't find the latest rating distribution of Codeforces, I created it.
This plot only includes active users who has participated contests more than 5 times.
Past rating distribution
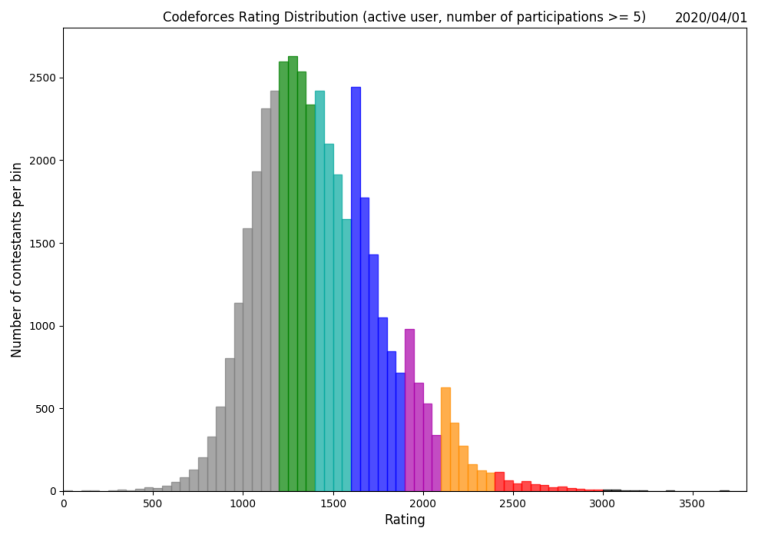
UPD: The plot is updated (2020/04/01)
UPD: Thanks to Gosunov, this plot has been updated again! (2021/07/09)


So according to the graph, there're more experts than specialists ? Interesting!
Expert is a 300 point band, whereas specialist is a 200 point band, so it's not that interesting :)
What is interesting, though — is the odd jump at start of each band. I wonder why that happens
some people are reluctant to join contests if they think their rank will fall / they'll lose colour. So they sit at the lowest rating with their colour for a long time.
It would be even more distorted if you count inactive users
Interesting. There are so many grandmasters. So I still got a long way to go
Almost Binomial Distribution.Interesting!
Actually It's not that interesting, binomial distribution is expected to happen in most distributions related to ratings.
What is the median rating?
Here are the statistical features.
I think your data is fake. Rating 1509 can be in the top 25%? I can't believe it!
It may be correct, don't forget that in your first contest you rate starts from 1500 + There are people who make fake accounts and join like 1-2 contests and the leave it at like 1450-1600 rate
It is the features for all active users. If you pick up who has been participated contests more than 5 times, it will be look like this.
it didn't change much :)
Interestingly, the first bar of any color is always taller than the last bar of previous color. It points to the fact that many people stop participating in rated contests once they achieve a particular color, isn't it? Facts from stats!
How did you create the rating distribution? Can you please share the code.
Once you have the data, you can use open source softwares like gnuplot to draw various graphs from it.
How did you get the aggregated data? I am also interested in doing this kind of stuff
Codeforces API is useful for such things.
Here is my code.
I have updated the plot. It has some significant changes
This shows quantity has increased a lot, quality is still in queue.
I think that this is largely the effect of https://mirror.codeforces.com/blog/entry/77890
In the past, beginners started with a high initial rating. Then participating in contests naturally resulted in their rating going down into the grey zone. So people were motivated to abandon their old grey accounts and start new ones (with a high initial rating again). With this kind of behaviour, many people with actual low skills were not registered in the chart. Because of having too few contests. Or because of having their rating score somewhat higher than they deserve (thanks to multiple account re-rolling attempts and a bit of luck).
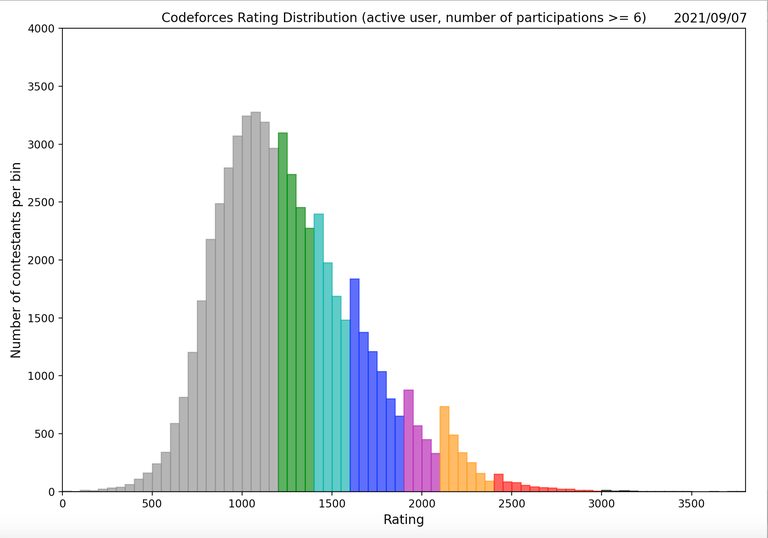
Could you please redo it with the number of participations >= 6? Beginners with only 5 contests don't have their rating fully converged and are missing the last 50 points: https://mirror.codeforces.com/blog/entry/77890
Here it is. Plot with the number of participations >= 6. Slight difference
Can I put this plot to the top, if you don't mind?
Of course I don't mind.
no. of contestants at the first bar of the next level is greater than last bar of the current level
Similarity with the Boltzmann distribution law.
Data fit with the law