


"Lies, damned lies, and statistics."
Big shoutout to macaquedev and all the people working on the cheater database. Their project has already identified 2,100+ verified cheaters. In my experience, they don't assign a cheater mark easily; some of my reports (which, to me, were clear cases of cheating) were rejected.
Here is a small survey on cheating statistics on Codeforces. We computed the rating distribution of caught cheaters and looked at some funny demographics.
Data
The list of handles of cheaters was taken from the macaquedev GitHub. Our small research is based mostly on this list. I used the Codeforces API to gather the rating and the corresponding country of each handle from the list.
Next, I used the Codeforces API to gather the number of active users (rated a contest in the last 6 months) per country.
Rating distribution of caught cheaters
The following graph is a little tricky. We should take into account that relatively higher-rated cheaters tend to cheat more cleverly. That is probably one of the reasons why there aren’t as many cheaters in the blue range as one might expect.
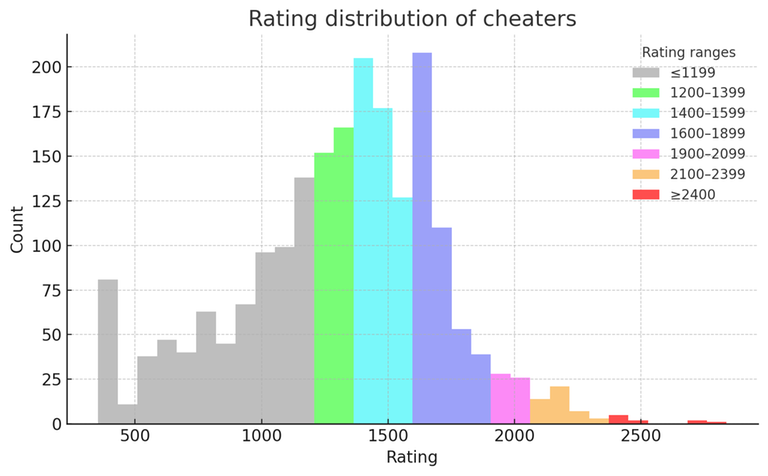
Here is a more detailed table with the percentages: byrange.csv
Demographics of caught cheaters
Since many people don't list their country on CF, in this section I only take into account users with listed countries. Sadly, we lose more than half of the data here.
I was not satisfied with claims that we see cheaters from region X more often than from other regions simply because there are a lot of participants from region X. To me, this statement is too loose.
How about applying Bayes’ formula? How about computing the conditional probability $$$P[\text{cheater} \mid \text{country X}]$$$?
Let’s make a simple computation:
Here is the problem: I don’t know how to estimate $$$P[\text{cheater}]$$$. Of course, there are many more cheaters than the 2100 listed in the database. So, instead, for each country X we compute the ratio $$$\frac{P[\text{cheater} \mid \text{country X}]}{P[\text{cheater} \mid \text{reference country}]}$$$
Then $$$P[\text{cheater}]$$$ cancels out and we have
As the author of this blog, I choose Russia as the reference country.
Thus, for each country X we need to estimate probabilities $$$P[\text{country X} \mid \text{cheater}]$$$ and $$$P[\text{country X}]$$$.
- cheaters% — % of all identified cheaters who are from the country. It estimates $$$P[\text{country X} \mid \text{cheater}]$$$ and is computed as $$$\frac{\text{number of cheaters from X}}{\text{number of cheaters with identified country}} \cdot 100 $$$.
- users% — % of all identified users who are from the country. It estimates $$$P[\text{country X}]$$$ and is computed as $$$\frac{\text{number of users from X}}{\text{number of users with identified country}} \cdot 100$$$
- rate% — $$$\dfrac{P[\text{cheater} \mid \text{country} X]}{P[\text{cheater} \mid \text{Russia}]} \cdot 100$$$.
Now we can observe the computed values. I dropped countries with less than 5 cheaters caught, so that our inference is more stable.
| country | cheaters | cheaters% | users% | rate% |
|---|---|---|---|---|
| India | 530 | 61.92 | 45.02 | 4.0921 |
| Vietnam | 46 | 5.37 | 3.44 | 4.6476 |
| Bangladesh | 34 | 3.97 | 11.19 | 1.0557 |
| Egypt | 32 | 3.74 | 7.02 | 1.5837 |
| China | 31 | 3.62 | 9.69 | 1.1115 |
| Pakistan | 27 | 3.15 | 0.58 | 16.0755 |
| United States | 13 | 1.52 | 1.48 | 3.0494 |
| Russia | 13 | 1.52 | 4.52 | 1 |
| Iran | 10 | 1.17 | 1.04 | 3.3395 |
| Palestinian Territory | 8 | 0.93 | 0.94 | 2.9611 |
| Azerbaijan | 8 | 0.93 | 0.34 | 8.1122 |
| Japan | 8 | 0.93 | 0.75 | 3.6908 |
| South Korea | 6 | 0.7 | 0.76 | 2.7551 |
| Brazil | 5 | 0.58 | 1.13 | 1.5379 |
| Kazakhstan | 5 | 0.58 | 1.18 | 1.4683 |
| Romania | 5 | 0.58 | 0.56 | 3.1301 |
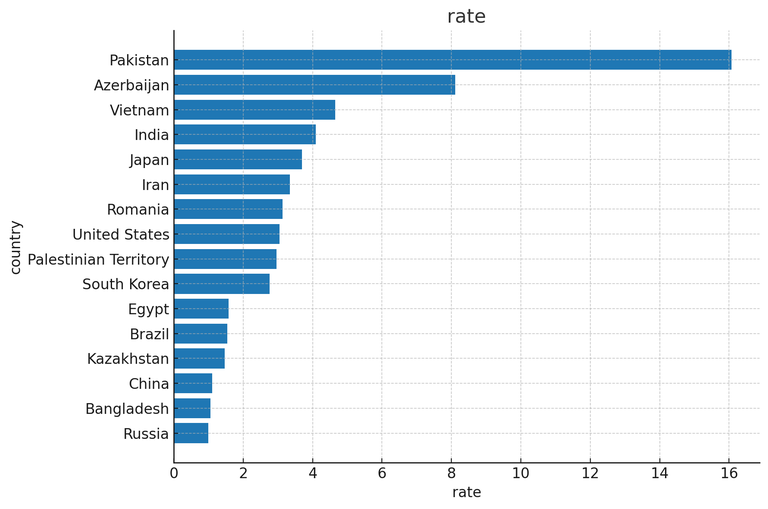
Here is a visualization with the rate sorted in descending order.
Limitations
I am not biased at all, and I didn’t expect such results. However, keep in mind that the sample size is still not very large (except for India), so the inference can be noisy. Also, note that I don’t build confidence intervals, so the differences between some pairs of countries may not be statistically significant.
For the rating distribution of cheaters, I've already noted that it naturally doesn't give a precise reflection of the reality.
Conclusions
We provided a rough estimate of the factors by which the rate of cheating differs by country and debunked claims like 'they cheat a lot because there are just a lot of them'. To make the estimates and the statistics in blue/purple range more precise, please, report more cheaters.


