Introduction
Recently there have been several suggestions that there is significant rating inflation now due to COVID-19. The typical hypothesis seems to be along the lines of:
Because people stay at home more now, there is a lot of new inexperienced users who add a lot of rating to the system, pushing "old" users upwards without actual improvement.
A simplified and a bit more general hypothesis that I'm going to test:
Because of the virus I'm gaining more rating than usual without working more.
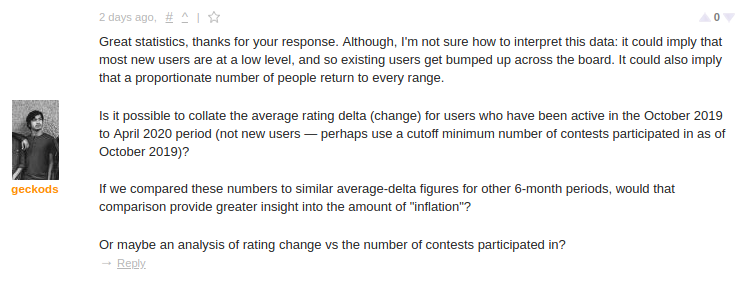
But most of these comments are based on anecdotal evidence, which is not worth much. I wanted to see if there is any truth to these claims. Specifically, this blog is an implementation (although I modified the approach a bit) of the following comment by geckods:

Methodology
Let's define the "test period" and "control period".
The test period refers to the period from 12 March 2020 to 12 Apr 2020. It was around 12 March when coronavirus became a big deal in most of the world, and for most of the Codeforces userbase. In that period, we had:
- 2 Div. 1 contests
- 5 Div. 2 contests
- 2 Div. 3 contests
- 2 Educational rounds
- 1 Global round
The control period is another period that should be "reasonably similar" to the test period, in terms of both length and the contests held. It should be from before coronavirus was known, even to China. It also can't be from too long ago. I have chosen 26 Sep 2019 to 26 Oct 2019. It fits all the criteria; as a matter of fact the "contest summary" is the exact same, except for an additional unrated Technocup mirror. But I have provided the code, you can try other periods and other period lengths.
Consider the users who were active during these periods: at least 3 contests in both periods. If our hypothesis is true, then the distribution of rating changes of these users would be different: these users would have gained more rating during the test period, compared to the control period. It also might be that there is rating inflation in Div. 2, but it has not "propagated" to Div. 1 yet, so it's interesting to see what happens if we take the initial rating into account.
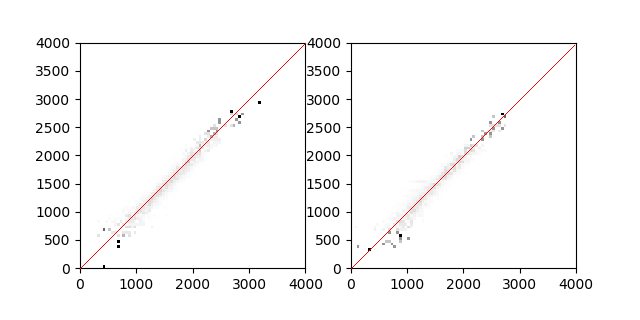
In short, we are asking "Given an user who had rating $$$x$$$ at the beginning of the test period, what was their rating at the end of the test period?" and comparing it to "Given an user who had rating $$$x$$$ at the beginning of the control period, what was their rating at the end of the control period?".
I have implemented it here.
Results
The graph on the left corresponds to the test period, the graph on the right corresponds to the control period. The color of the $$$i$$$-th row and $$$j$$$-th column corresponds to the probability that a participant with rating $$$i$$$ a the beginning of the period would have rating $$$j$$$ at the end of the period. Black corresponds to probability 1, white to probability 0.

I don't want to jump into conclusions from this data, I'll leave it up to you to interpret it. But just from these it seems that there is no serious inflation. Of course, one month is a short period to see the effects. And it does seem that the left graph shows a bit of inflation, but it's hard to tell. At least it seems to cast doubts on the "my rating has risen more without me working more!" claim. I think that if your rating has risen in the last month, you're just getting better even if you don't "feel better", don't worry so much about inflation :)
Disclaimer: I'm not very experienced in statistics, I just decided to implement this because no one else seemed to and I was also curious about what the result would be.


