Sometimes I wonder, what implementation of a segment tree to use. Usually, I handwave that some will suit, and that works in most of the cases.
But today I decided to back up the choice with some data and I ran benchmarks against 4 implementations:
- Simple recursive divide-and-conquer implementation Code
- Optimized recursive divide-and-conquer, which does not descend into apriori useless branches Code
- Non-recursive implementation (credits: https://mirror.codeforces.com/blog/entry/18051) Code
- Fenwick Tree Code
All implementations are able to:
-
get(l, r): get sum on a segment (half-interval) $$$[l; r)$$$ -
add(i, x): add $$$x$$$ to the element by index $$$i$$$
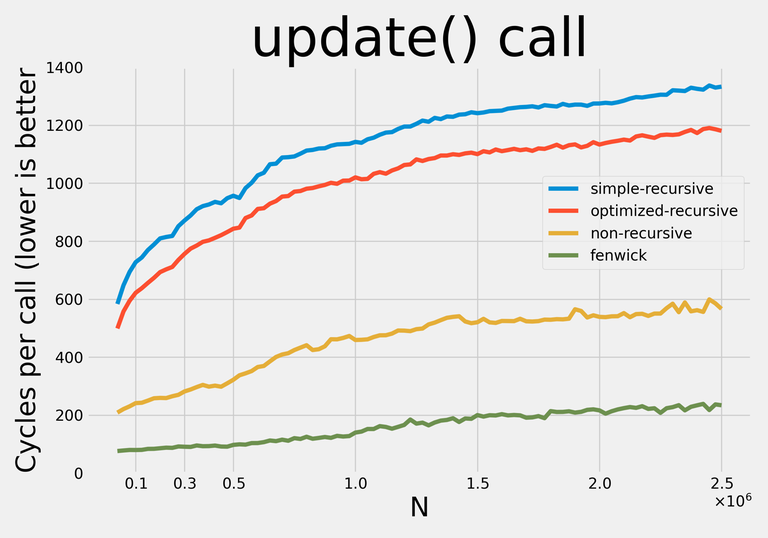
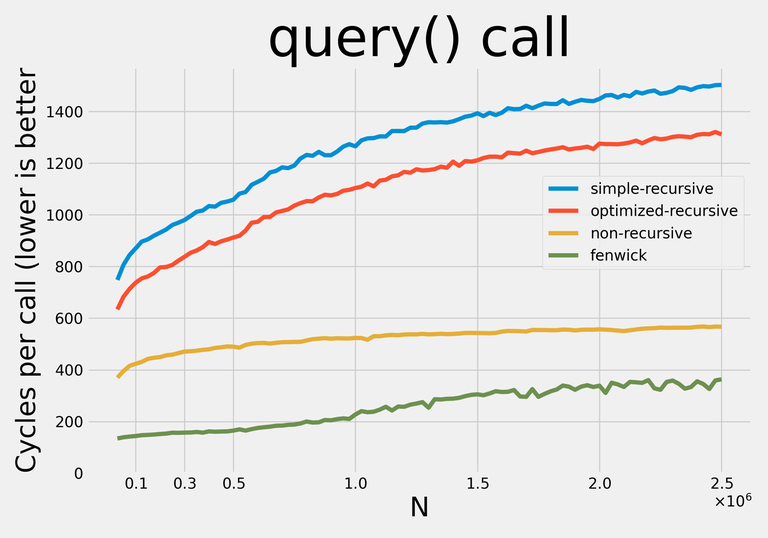
Here are the results: 

Note: I decided not to apply any addition-specific optimizations so that with minor modifications the data structures could be used for any supported operations.
I generated queries the following way:
- Update: generate random index (
rnd() % size) and number - Query: at first, generate random length (
rnd() % size + 1), then generate a left border for that length
Benchmarking source code. Note that ideally you should disable frequency scaling, close any applications that might disrupt the benchmark (basically, the more you close — the better) and pin the benchmark process to a single CPU (core).
My benchmarking data in case you want to do some more plotting/comparing.
I compiled the benchmark with #pragma GCC optimize("O3") on GNU GCC 11.3.0, and ran it with the CPU fixed on 2.4 GHz, the process pinned on a single CPU core and the desktop environment closed.
This is probably my first useful contribution so any suggestions/improvements are welcome.


Auto comment: topic has been updated by pavook (previous revision, new revision, compare).
All good, but benchmark have 1 error: Fenwick != Segment tree
Although it's technically true, Fenwick tree and non-recursive segment tree are similar both in structure and in performance. It's also a frequent "dilemma": implementing Fenwick tree or segment tree, so its addition felt appropriate.
I do not consider the Fenwick tree and the non-recursive segment tree to be similar in structure.
You can think of a Fenwick tree as a complete segment tree with all right children removed.
Even if it's true, you still can't perform many types of complex operations using Fenwick tree, so imho Fenwick tree is quite useless for regular contests... Anyway, thanks for the blog, it was really interesting :)
Fenwick tree is useful when TL is tight or (if the task allows) if writing a Segment tree will be too long.
I think a pointer-based segment tree is missing.
Thanks for the job you have already done!
However, in my option, it doesn't provide any useful information. It's more a toy research project as you eventually learn different segment tree implementation than a serious benchmark because it simply says something like recursive > non-recursive > fenwick as expected with g glance.
To improve, I list several possible direction here:
Thank you very much for the suggestions.
Notably, non-recursive query has a remarkably constant constant :).
The sudden jumps in update constant plot you can see (at $$$N \approx 275000$$$ for recursive implementations, at $$$N \approx 450000$$$ for non-recursive implementation) align quite nicely with tree sizes beginning not to fit in my 8M L3 Cache.
I couldn't figure anything else special about the plots, so any help/ideas would be appreciated.
CPU model: Intel(R) Core(TM) i5-1135g7. I did run it in full-power mode (perf-bias set to 0 and perf-policy set to performance). I reran the benchmark with pinning the process to a CPU core using
taskset, thank you for this advice.About cache misses and other advanced metrics: I feel like that information would be quite a pain in the butt to collect. I don't know how to measure those metrics except for tools like
perf. But if I'm going useperfor something similar, I'll need to run all the instances separately and collect the results separately. That would really blow up the complexity of running the benchmark.Auto comment: topic has been updated by pavook (previous revision, new revision, compare).